Create a report:
This article assumes you are familiar with the basics of writing custom graphs in Spira.
In this example we will be using a custom report with a custom ESQL section.
To create the report you need to:
- Go to Administration > Edit Graphs
- Click on Add a New Custom Graph (at the bottom of the list of existing graphs)
- Give it a meaningful name
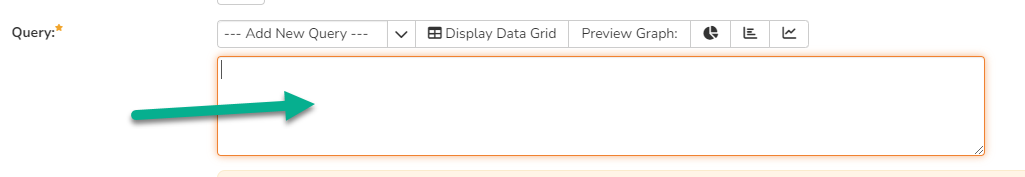
- Copy and paste below ESQL code into the Query section:
SQL Query:
5. Paste into the Query section the query itself and then Save it:
select Total.BUILD_NAME,
SUM(Total.Passed) as Passed,
SUM(Total.Blocked) as Blocked,
SUM(Total.Caution) as Caution,
SUM(Total.Failed) as Failed
from
(
(select CASE
WHEN TR.BUILD_NAME IS NULL
THEN '(Not Set)'
ELSE TR.BUILD_NAME
END as BUILD_NAME,
COUNT(TR.EXECUTION_STATUS_NAME) as Passed, 0 as Blocked, 0 as Caution, 0 as Failed
from SpiraTestEntities.R_TESTRUNS as TR
where TR.PROJECT_ID = ${ProjectId} AND TR.EXECUTION_STATUS_NAME = 'Passed'
group by TR.BUILD_NAME)
union
(select CASE
WHEN TR.BUILD_NAME IS NULL
THEN '(Not Set)'
ELSE TR.BUILD_NAME
END as BUILD_NAME,
0 as Passed, COUNT(TR.EXECUTION_STATUS_NAME) as Blocked, 0 as Caution, 0 as Failed
from SpiraTestEntities.R_TESTRUNS as TR
where TR.PROJECT_ID = ${ProjectId} AND TR.EXECUTION_STATUS_NAME = 'Blocked'
group by TR.BUILD_NAME)
union
(select CASE
WHEN TR.BUILD_NAME IS NULL
THEN '(Not Set)'
ELSE TR.BUILD_NAME
END as BUILD_NAME,
0 as Passed, 0 as Blocked, COUNT(TR.EXECUTION_STATUS_NAME) as Caution, 0 as Failed
from SpiraTestEntities.R_TESTRUNS as TR
where TR.PROJECT_ID = ${ProjectId} AND TR.EXECUTION_STATUS_NAME = 'Caution'
group by TR.BUILD_NAME)
union
(select CASE
WHEN TR.BUILD_NAME IS NULL
THEN '(Not Set)'
ELSE TR.BUILD_NAME
END as BUILD_NAME,
0 as Passed, 0 as Blocked, 0 as Caution, COUNT(TR.EXECUTION_STATUS_NAME) as Failed
from SpiraTestEntities.R_TESTRUNS as TR
where TR.PROJECT_ID = ${ProjectId} AND TR.EXECUTION_STATUS_NAME = 'Failed'
group by TR.BUILD_NAME)

) AS Total
group by Total.BUILD_NAME
order by Total.BUILD_NAME asc
Query Explanation:
To get the table we need for the graph, we used here nested select approach in conjunction with union operator to unite several selects into one table.
The 'parent' SELECT uses the alias 'Total' to refer the columns in nested selects.
The CASE operator in each of nested SELECTs helps to identify where Build is not applicable and marks it as 'Not Set'.
Each nested select has the same structure - this is the implicit requirement for UNION operator to success.
Also, in the same CASE cycle we're counting the number of test execution per statuses.
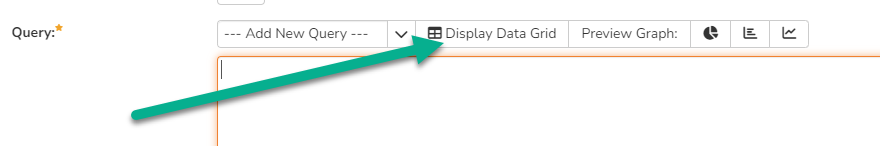
Running the query
To run the query and see the results in the table view - click on Display Data Grid button:
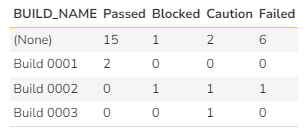
The sample output of that action looks like this:
Then click on one of the available chart types (bar or line in this case available) to Preview the graph:
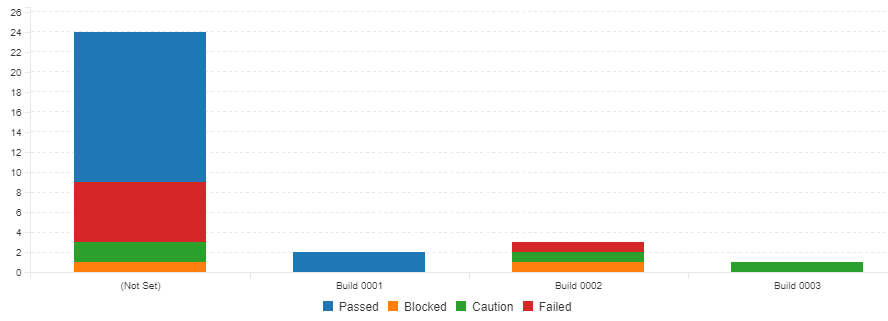
Graph sample usage:
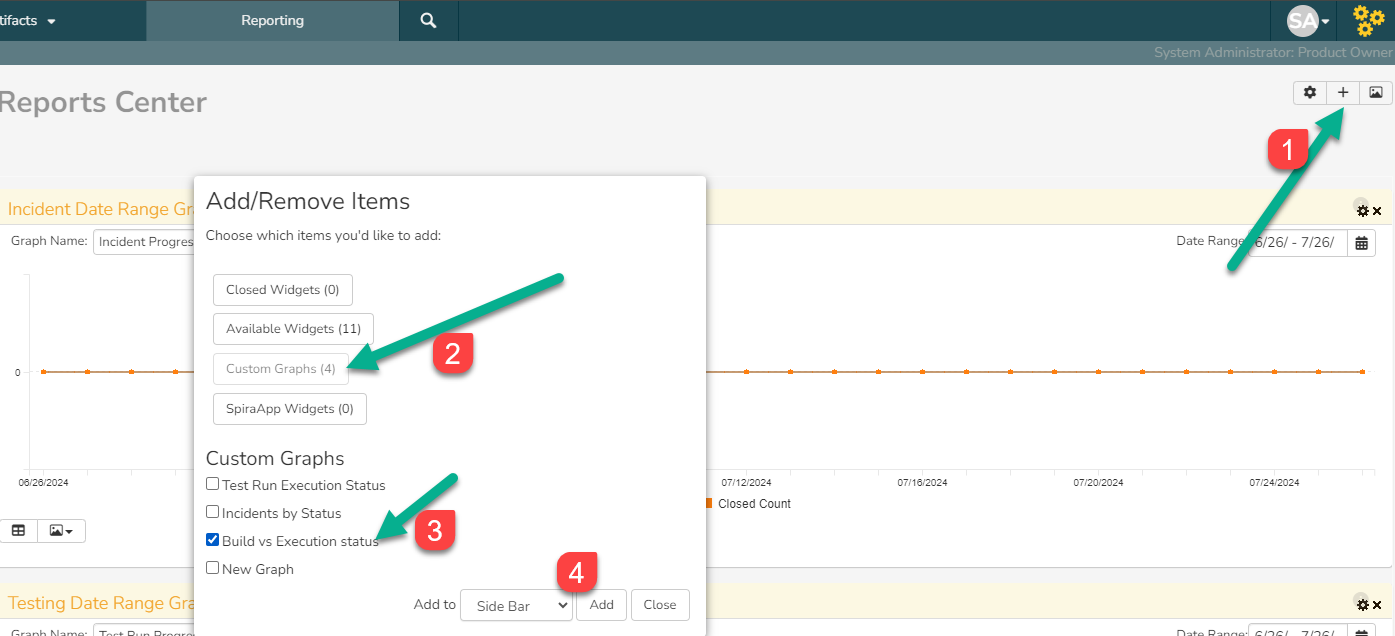
Custom graph can be added manually to Report Center dashboard: