Create a report:
This article assumes you are familiar with the basics of writing custom reports in Spira.
In this example we will be using a custom report with a custom ESQL section.
To create the report you need to:
- Go to Administration > Edit Reports
- Click on Create a new Report (at the bottom of the list of existing Reports)
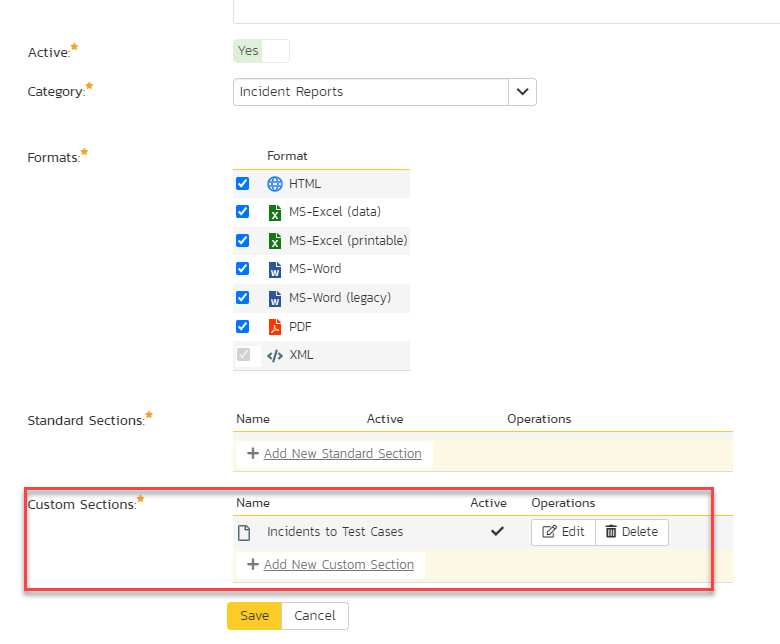
- Specify that it should allow generation in MS-Word, Excel, HTML and PDF formats
- Choose to add a Custom Section:
SQL Query:
- Paste into the Query section the query itself.
SELECT US.FIRST_NAME + ' ' + US.LAST_NAME AS NAME_LASTNAME, HCS.ARTIFACT_DESC AS LOGIN,
(CASE WHEN HD.OLD_VALUE = 'Global_Yes' THEN 'YES' ELSE 'NO' END) AS IS_ADMIN_OLD_STATUS,
(CASE WHEN HD.NEW_VALUE = 'Global_No' THEN 'NO' ELSE 'YES' END) AS IS_ADMIN_NEW_STATUS,
HD.CHANGE_DATE
  FROM SpiraTestEntities.R_GLOBAL_HISTORYDETAILS AS HD
  INNER JOIN SpiraTestEntities.R_GLOBAL_HISTORYCHANGESETS AS HCS ON HD.CHANGESET_ID = HCS.CHANGESET_ID
  INNER JOIN SpiraTestEntities.R_USERS AS US ON HD.ARTIFACT_ID = US.USER_ID
  WHERE HD.FIELD_NAME = 'IsAdmin' AND HD.OLD_VALUE !=HD.NEW_VALUE AND HD.ARTIFACT_TYPE_ID = -3
Click the 'Create Default Template' option to generate the following XSLT report template or use the generated XSLT template:
<?xml version="1.0" encoding="utf-8"?>
<xsl:stylesheet version="1.0" xmlns:xsl="http://www.w3.org/1999/XSL/Transform" xmlns:msxsl="urn:schemas-microsoft-com:xslt" exclude-result-prefixes="msxsl">
  <xsl:template match="/RESULTS">
    <table class="DataGrid"><tr><th>NAME_LASTNAME</th><th>LOGIN</th><th>IS_ADMIN_OLD_STATUS</th><th>IS_ADMIN_NEW_STATUS</th><th>CHANGE_DATE</th></tr>
      <xsl:for-each select="ROW">
        <tr><td><xsl:value-of select="NAME_LASTNAME"/></td><td><xsl:value-of select="LOGIN"/></td><td><xsl:value-of select="IS_ADMIN_OLD_STATUS"/></td><td><xsl:value-of select="IS_ADMIN_NEW_STATUS"/></td><td><xsl:value-of select="CHANGE_DATE"/></td>
        </tr>
      </xsl:for-each>
        </table>
    </xsl:template>
</xsl:stylesheet>
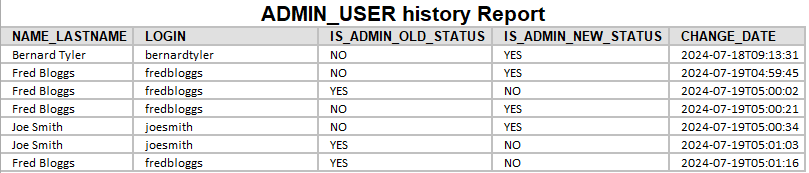
Running the report and expected output
As a result of the report execution you should get something like: