Create a Graph
First, you need to create a Custom Graph :
- Go to Administration > Edit Graphs
- Click Add New Custom Graph
- Specify that it applies to the Product.
- Insert the ESQL query into the Query section
select XY.CREATION_DAY, count(XY.TEST_CASE_ID) as TestCaseCount
from
(select TC.TEST_CASE_ID, cast(year(TC.CREATION_DATE) as string)+ '/' + cast(month(TC.CREATION_DATE) as string) + '/' + cast(day(TC.CREATION_DATE) as string) as CREATION_DAY
from SpiraTestEntities.R_TestCases as TC
where TC.PROJECT_ID = ${ProjectId} and TC.CREATION_DATE > DATETIME '2024-01-01 01:01:00.000') as XY
group by XY.CREATION_DAY
Previewing the Results
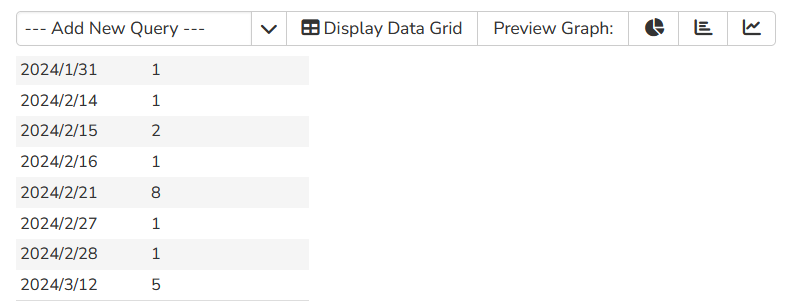
Now you can click the option to display the data grid of the results:
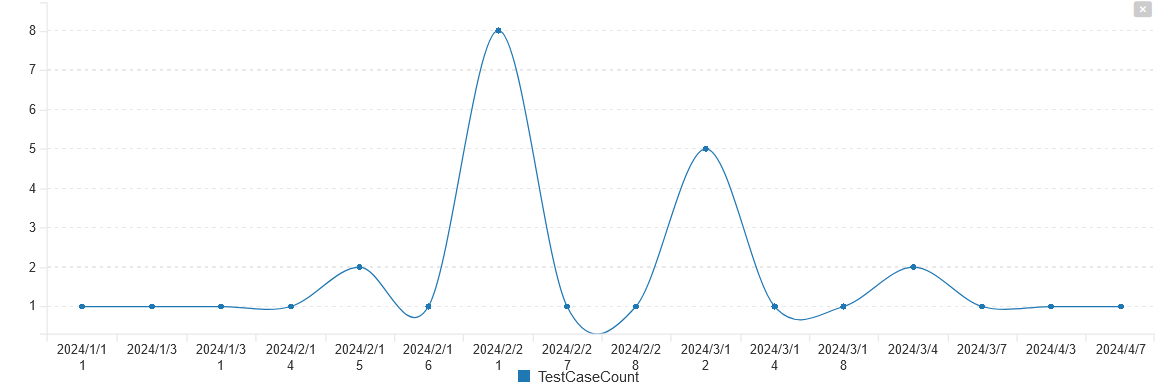
Finally, you can now display the line graph of the test case creation count per day:
Now you can click the Save buttons to save the custom graph and make it available for users to add to their reporting dashboard.