Overview
The final report creating in this article is effectively the same as that from [KB461], but here we use PowerBI and its features.
Collecting the Data
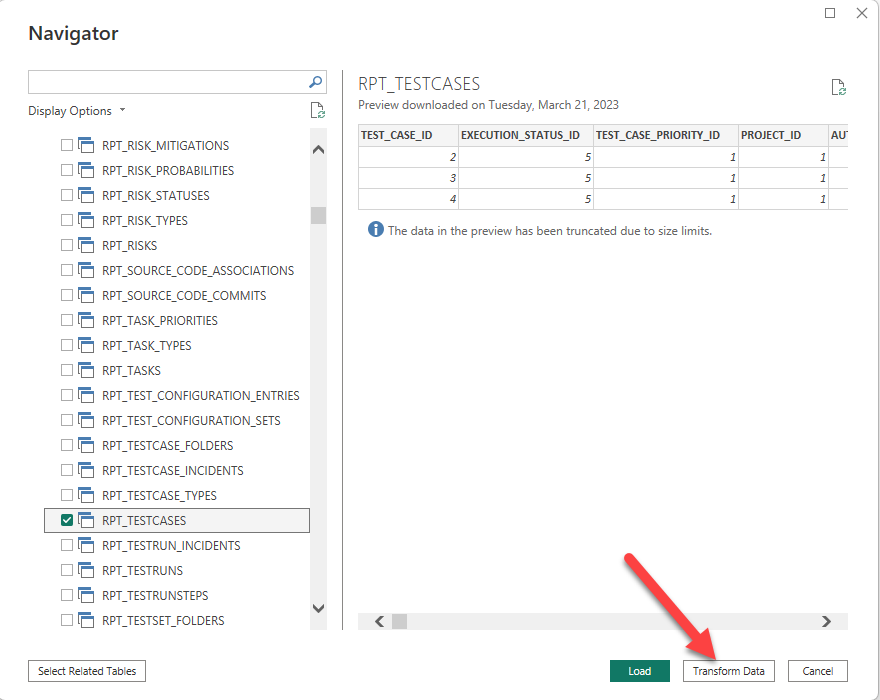
1. Connect to the Database
2. Choose three tables/view using Navigator: RPT_TestCases, RPT_Incidents and RPT_TestCase_Incidents
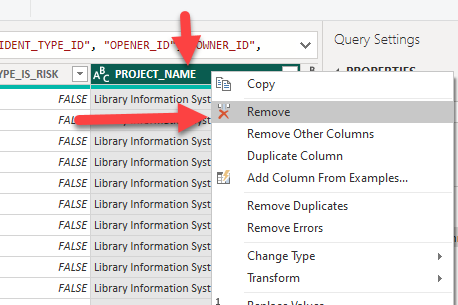
3. Click on Transform Data before loading
4. You can select and remove all the fields that not being used in this report so to keep it as clean as possible:
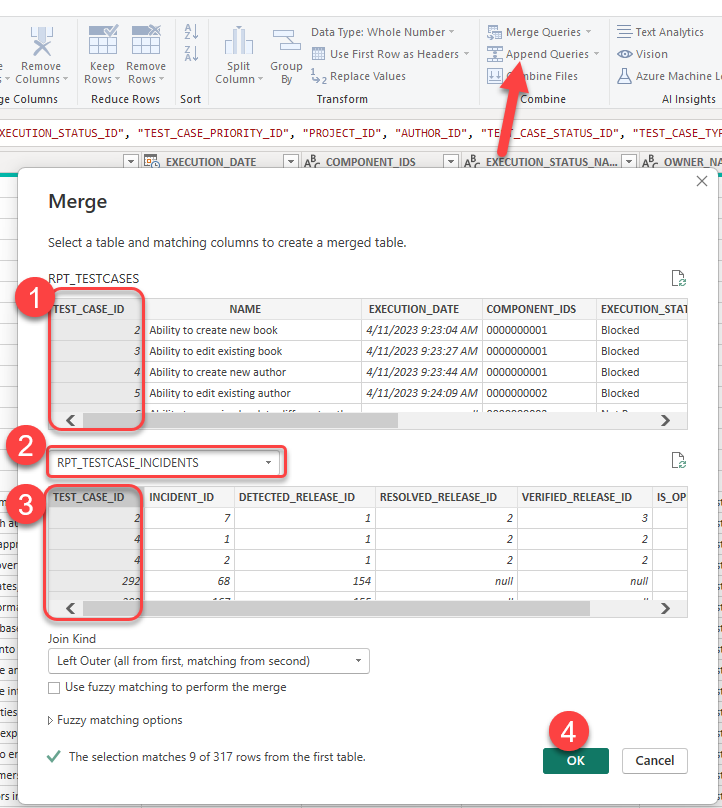
Merging Queries (JOIN operation)
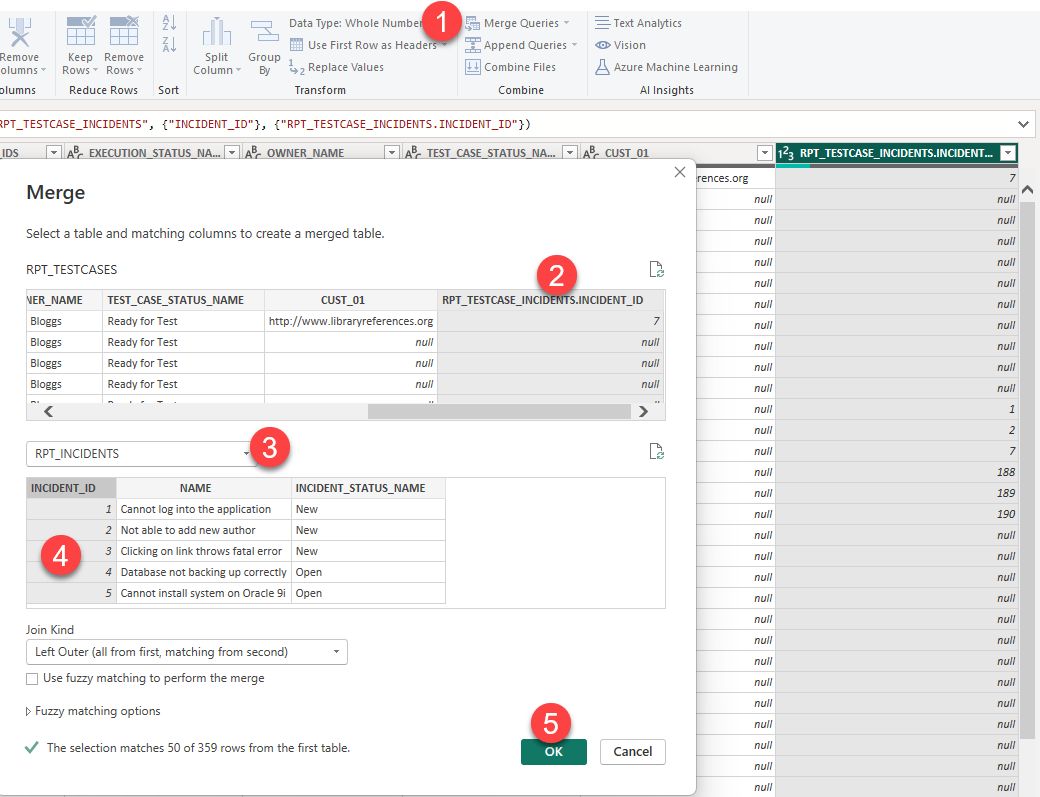
5. In Transform window click Merge Queries, choose the Test_Case_ID column (that is the unique key parameter ) to match in the Test_Case_Incidents table with the same Test_Case_ID column:
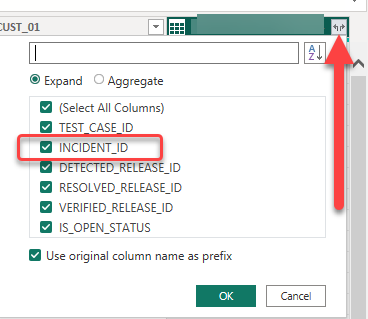
6. Click on the double arrow button within the header of column just added into this table and choose Incident_ID to add:
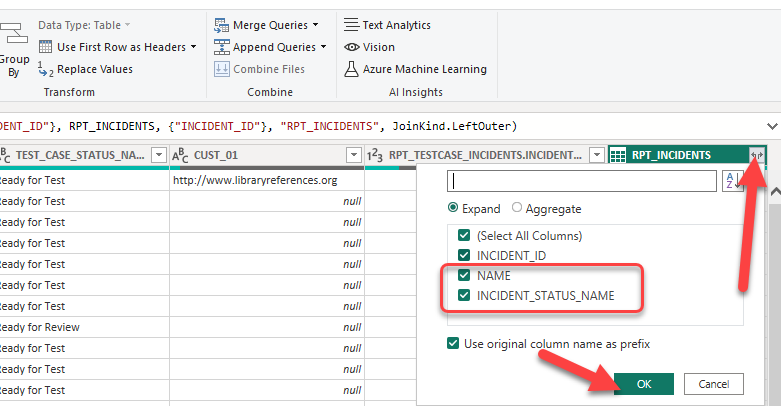
7. Repeat the operation to add the missing information from Incidents table with the difference that now we're matching Incident_IDs from RPT_Incidents table:
8. Choose the Name and Status to be added into this table:
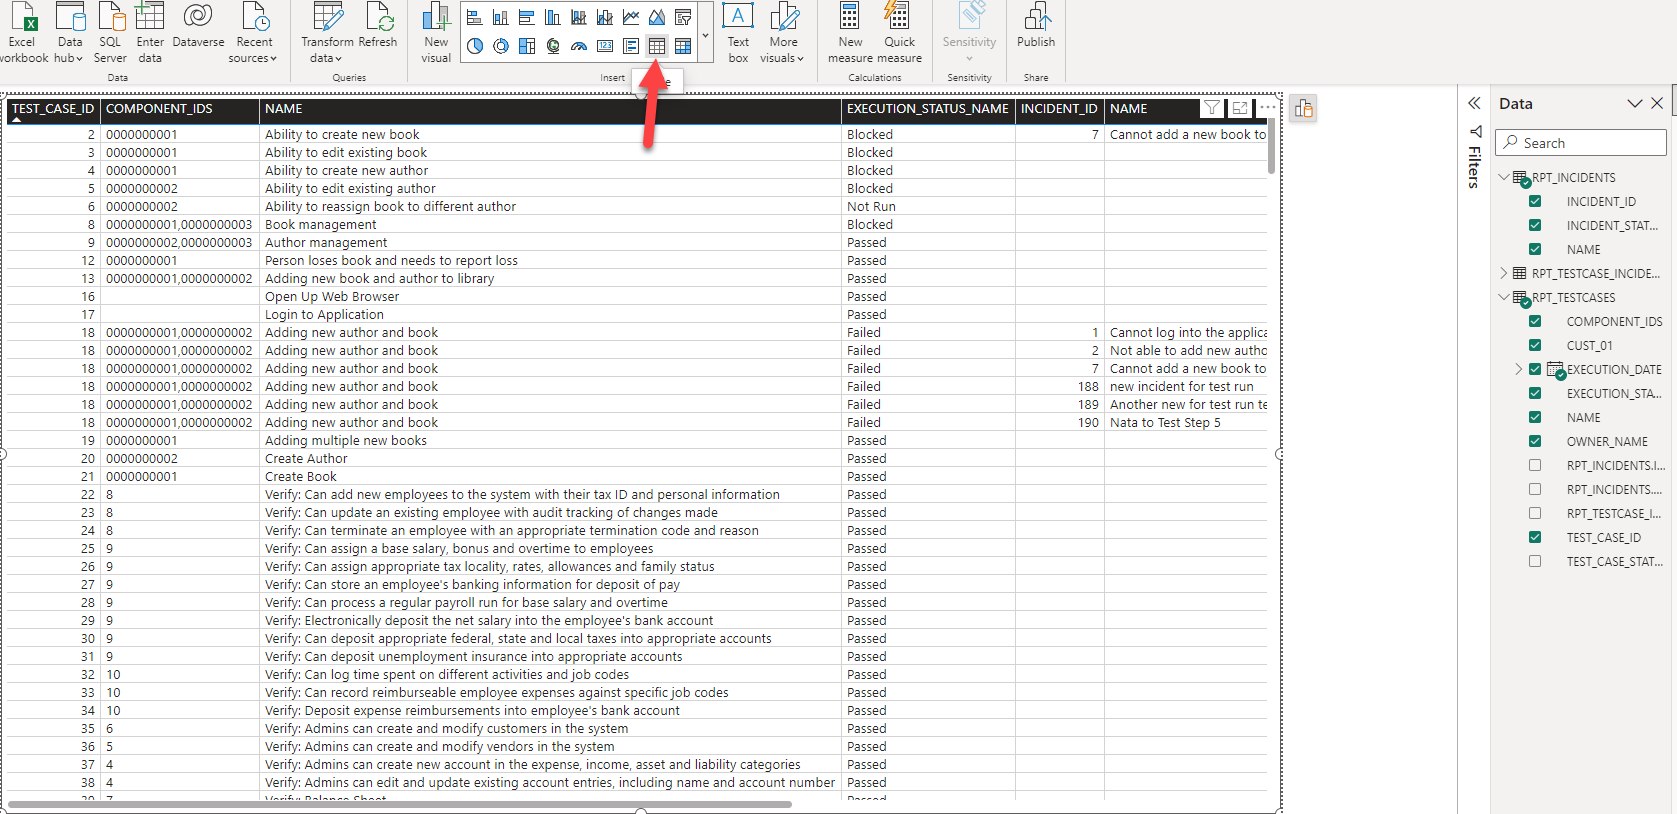
Building the Table
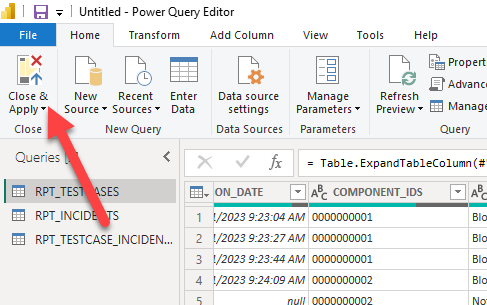
9. Click Close&Apply
10. Create a table and choose the columns in desired sequence: